Chapter 47 SPSS preprocessing
47.1 Checking the level of measurement
Once the data have been imported, you should screen them for accuracy and plausibility. Initially, you should check if SPSS got the level of measurement correct when importing the data. This is important as the descriptive (and inferential) statistics that can sensibly be calculated for a variable depend on it being associated with the correct level of measurement. We can check the level of measurement by going to Variable View at the bottom of the Data Editor window:

One of the columns in the Variable View is Measure. For data identified as numeric in the Type column, there are three options:
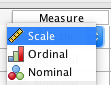
Nominal should be used for categorical data, ordinal for rank-ordered data and scale for interval and ratio data. We should make sure the correct level of measurement is selected for each of our variables.
47.2 Defining missing values
In the Variable View, SPSS tells us the data type of our variables. Usually, the data type will be numeric or string. To define missing values, there is an important difference between these two data types. For numeric data, empty cells in your input file work perfectly well and SPSS will automatically recognise these as missing data. These data will be marked by a period in the Data View.
Unfortunately, the situation is different for strings. SPSS does not automatically recognise empty strings as missing values. Instead, you have to tell SPSS what defines a missing value. As this is a bit of a pain if the cell is empty, we have already added the string missing to cells with missing data in the .csv file we imported. Note that you still need to tell SPSS that the string missing indicates missing data (i.e., SPSS does not automatically recognise that the string missing in a cell indicates that the data point is missing).
To define the missing value:
Go to Variable View
For each variable with the type
String(i.e.,colour_vision,genderandfirst_language), click onNonein the columnMissingThen click on the icon with the three dots
Click the radio button next to Discrete missing values
Enter
missingin the first text field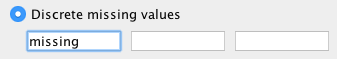
Click
OK
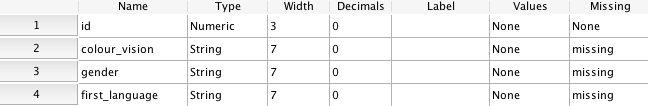
Note that the column Missing should now say missing for these variables:
47.3 Adding variable and value labels
Another useful thing to know is that in the Variable View, you can add labels and values. It is always a good idea to do this, as explained in this page about variable and value labels.
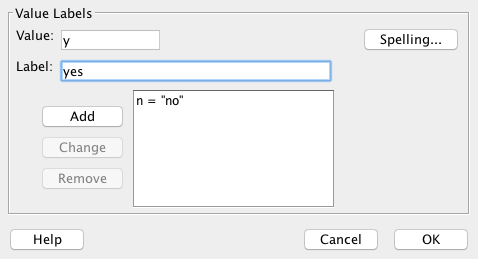
For example, you could use this for changing the label and values for “colour_vision”:
In the column Label, add “Normal colour vision?”
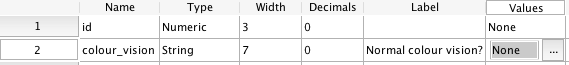
In the column Values, click on the icon with the three periods, and add the following value labels:
This approach is also very useful when creating graphs with SPSS (in particular, if your values are numeric). If you do not provide value labels, SPSS will simply use the numeric values provided which might make the output difficult to understand. For example, if female is coded as 1 and male as 2, having the output with 1 and 2 as labels is not really going to be helpful:
- You might forget what the numbers mean and incorrectly interpret your data.
- You make it harder for others to understand and interpret your data (including lab report markers!).
Note that it is possible to make the value labels visible in the Data View. Simply click on the Value Labels icon:
