Chapter 32 Descriptive statistics - next steps
32.1 Removing participants with missing data
We have a number of participants for whom we don’t know the age, the gender, the first language, or their colour vision abilities. We might decide that the best approach might be to also remove these participants from all analyses. Here is how to do this:
Click on Data → Select Cases
Click on “If condition is satisfied”
Click on “If…”
Enter the following information in the text field at the top:
colour_vision ~= "missing" & gender ~= "missing" & first_language ~= "missing" & ~ SYSMIS(age)- This tells SPSS to only select participants who do not have a missing value for any of the above variables
- The tilde symbol (
~) means not - Note how the approach differs for string variables (
colour_vision,genderandfirst_language) and numeric variables (age) - For the numeric variable, we need to use
SYSMIS(which stands for system missing value)
Click on “Continue”
Copy the filtered data to a new dataset:
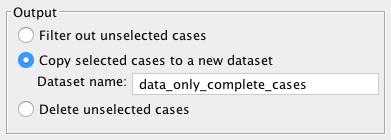
Note that you still need to save the newly created dataset as a
.savfile (note that the new window might be hiding behind the old data window).
Alternatively, you can filter out unselected cases. This allows you to later remove the filter if you want to exclude a subset of participants only temporarily. To reset the filter, you would go to Data → Select Cases → select All cases.
Note that removing participants with incomplete data might not be necessary. We have done this here to show you how it works and because there was only a relatively small number of participants affected. Whether or not it will be necessary to remove participants with missing data depends on how relevant knowing these data is for your analysis. For example, for our current example data set and analysis, knowing the age or gender does not appear to be critical. On the other hand, you might suspect that having a first language other than English or having impaired colour vision are important moderators of Stroop task performance. As a result, you might decide to exclude non-native speakers of English and participants with impaired colour vision from the analysis (and ideally you would back this decision up using published studies). For this reason, you might then also decide to remove participants whose first language or colour vision abilities are unknown.37
32.2 Adding variable and value labels
Another useful thing to know is that in the Variable View, you can add labels and values. It is always a good idea to do this, as explained in this page about variable and value labels.
For example, you could use this for changing the label and values for “colour_vision”:
In the column Label, add “Normal colour vision?”
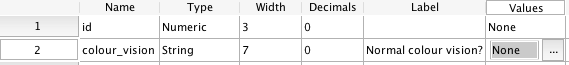
In the column Values, click on the icon with the three periods, and add the following value labels:
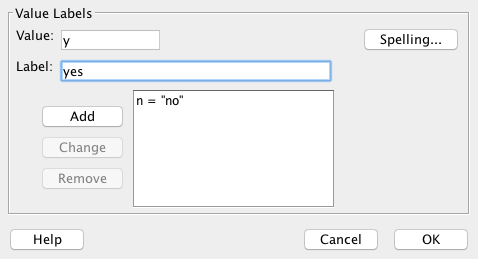
This would generate the following frequencies table:
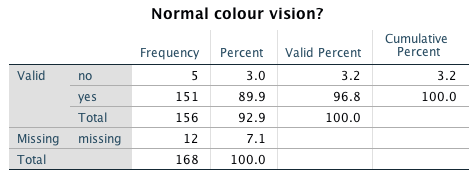
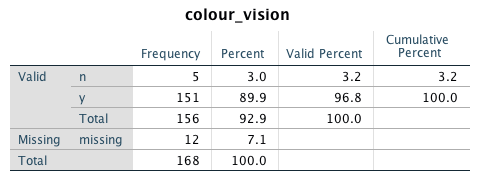
Compare this to the previous version:
This approach is also very useful when creating graphs with SPSS (in particular, if your values are numeric). If you do not provide value labels, SPSS will simply use the numeric values provided which might make the output difficult to understand. For example, if female is coded as 1 and male as 2, having the output with 1 and 2 as labels is not really going to help you. Most importantly, you might forget what the numbers mean and incorrectly interpret your data.
It’s even possible to make the value labels visible in the Data View. Simply click on this icon:

32.3 Descriptive statistics after screening and cleaning
We will finish by calculating some descriptive statistics on the cleaned data. This assumes the following:
- You have recoded the variables
colour_vision,genderandfirst_language - You have removed participants with close to chance performance
- You have removed participants with incomplete data
Thus, there should now be 156 cases in your dataset. Once you have made sure this is the case, please complete the exercise below.
32.4 Lab 12 Exercise 3
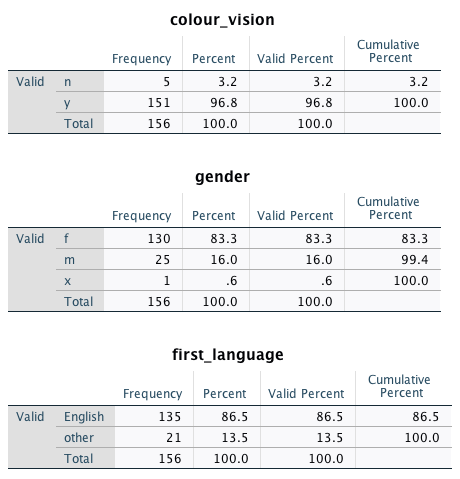
Follow the instructions from the Chapter Descriptives for categorical data to calculate the descriptive statistics for the variables colour_vision, gender and first_language for the current dataset. Make sure to select “Display frequency tables”.
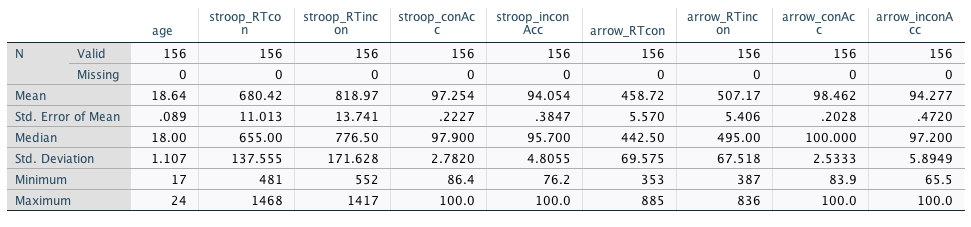
Follow the instructions from the chapter Descriptives for continuous data to calculate the descriptive statistics for the RTs and accuracies from the arrow flanker task and the Stroop task.
Solution categorical variables
Solution continuous variables