Chapter 30 Descriptives for categorical data
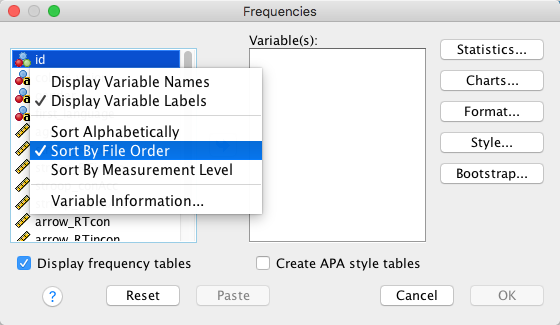
Initially, let’s have a look at the categorical variables (i.e., colour_vision, gender and first_language). To calculated some descriptive statistics, go to Analyze → Descriptive Statistics → Frequencies and add all categorical variables to “Variable(s)” (it is not necessary to add id, as this will not provide us with useful information). Note that what SPSS refers to as “APA style tables” is not really APA style (see here for actual APA style tables).

When the Frequencies window opens, you can right-click on the list of variables and change how they are sorted (e.g., you can sort them alphabetically or by measurement level.)
SPSS often requires moving variables from left to right, and vice versa. You do not need to do this individually for each variable. You can use these shortcuts instead:
- Select all variables:
Cmd + A(as always, Windows users should useCtrlinstead ofCmd) - Select a continuous range of variables: select first variable, hold down the
Shiftkey, and select the final variable → the full range of variables between the first and the final variable will be selected - Select a few non-adjacent variables: select one, hold down the
Cmdkey, and select the other variables
If you want to move a single variable and there is just one place where it can go, you can simply double-click on it. You can also drag and drop individual variables.
Frequencies offers us the following options:
- Statistics: Make sure none of these are selected (apart from the mode, computing these statistics is not meaningful or informative for categorical data and we can easily get the mode from the frequency table we’ll create)
- Charts: Make sure
Noneis selected (you can choose “Bar Charts”, but it won’t provide you with useful information that you won’t already get from the frequency table) - Format: Not currently of interest
- Style: Not currently of interest
- Bootstrap: Not currently of interest
Finally, make sure that Display frequency tables is checked, and click on “OK”.
After clicking “OK”, an output window will open, displaying a number of tables. The first table allows you to check for missing values:
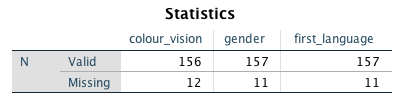
It turns out that we have up to 12 missing values for our categorical variables.
The next tables about the valid values for each of the variables. Let’s have a look at the output for colour_vision:
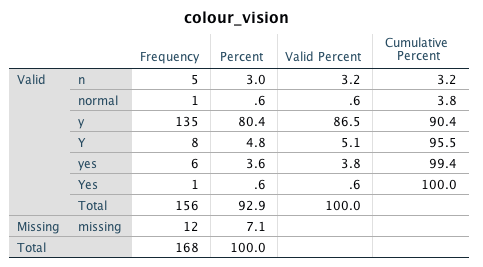
In PsychoPy, the question was “Normal colour vision?” and the response options were given as y and n. However, we notice that not all participants have entered the instructed values. (Please note that, like Python, SPSS is case-sensitive, and y and Y are considered to be different values.) There are similar issues with the other variables. However, for all of the cases it seems that we can easily decode what the participants meant. Therefore, it will be relatively straightforward to correct the values. We will use the colour_vision variable to demonstrate how to do this.
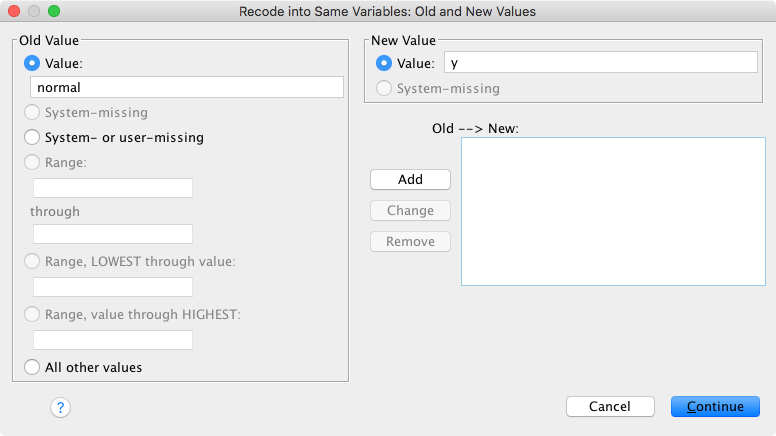
Go to Transform → Recode into Same Variables
Move
colour_visionto the field “Variables”Click on “Old and New Values”.
Enter the “Old Value”, then the “New Value”, and then click on “Add”
You should end up with the
Old --> Newfield looking like this: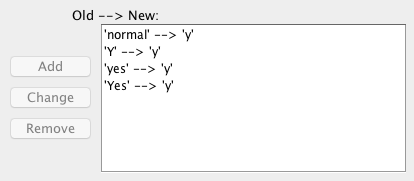
Click “Continue” and “OK”. Run Frequencies again to check that the recoding has worked:
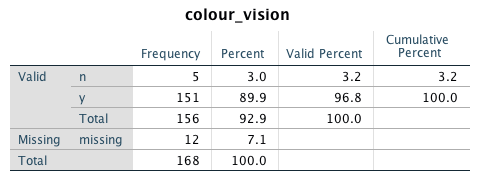
If your table has the same frequencies as the one above, you have successfully computed the frequencies of the colour vision variable.
30.1 Lab 12 Exercise 2
Recode the variables gender and first_language.
gender should be recoded into f, m and x. x was the option for non-binary gender identities.
first_language should be recoded into English and other.
Run Frequencies again to check that the recoding was successful.
Solution
After recoding, there should 131 females, 25 males and 1 non-binary participant. Also, there should be 136 native English speakers, and 21 participants with a different first language. Missings should remain unchanged.
If you want to be on the safe side, go for Recode into Different Variables. In this case, SPSS will keep the original variable and you can easily correct errors if something went wrong during recoding. However, the process is a bit more involved. First, you need to provide SPSS with a new variable name (e.g., colour_vision_recoded), then you need to add the old-new changes as just described, but in addition you must tell SPSS to “Copy old value(s)” and click on “Add”, so that SPSS displays ELSE --> Copy in the Old --> New field. You might also need to indicate that “Output variables are strings”.
What you could also do is to initially recode into a different variable, check if everything is correct and then delete the original variable. In this way, your total number of variables will not increase and it will be easier to keep track of things.