Chapter 29 Intro to descriptive statistics
This week we are going to focus on using SPSS to calculate descriptive statistics. In particular, we are going to focus on screening and cleaning data as a step that should precede the calculation of descriptive statistics. We will use the same data as last week. You can either use your SPSS data file to which you added the interference effects or you can re-download the data.
You can re-download the data here.
29.1 Checking the level of measurement
Once the data have been imported, you should screen them for accuracy and plausibility. Initially, you should check if SPSS got the level of measurement correct when importing the data. This is important as the descriptive (and inferential) statistics that can sensibly be calculated for a variable depend on it being associated with the correct level of measurement. We can check the level of measurement by going to Variable View at the bottom of the Data Editor window:

One of the columns in the Variable View is Measure. For data identified as numeric in the Type column, there are three options:
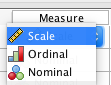
Nominal should be used for categorical data, ordinal for rank-ordered data and scale for interval and ratio data. We should make sure the correct level of measurement is selected for each of our variables.
29.2 Lab 12 Exercise 1
If your version of SPSS is like mine, one of the measures will be incorrect. Can you work out which one it is and why the level of measurement is incorrect?
Hint 1
Levels of measurement are defined by the type of operations you can meaningfully perform on the data. For example, scale-level data should allow you to compute means, ordinal-level data to compute medians and categorical-level data to compute frequencies.
Hint 2
Is there a scale variable for which it would not make sense to compute a mean?
Solution
It’s the participant ID. This is certainly numeric (see Type), but it is not at scale level (or ordinal level, for that matter). It is a categorical variable. The reason is that assignment of IDs to participants is completely arbitrary. It does not indicate a more or less of something we measured. Participant 1 is not “better” than, say, Participant 89.
29.3 Defining missing values
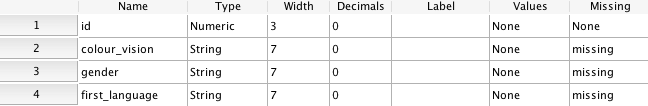
In the Variable View, SPSS tells us the data type of our variables. Usually, the data type will be numeric or string. To define missing values, there is an important difference between these two data types. For numeric data, empty cells in your input file work perfectly well and SPSS will automatically recognise these as missing data. These data will be marked by a period in the Data View.
Unfortunately, the situation is different for strings. SPSS does not automatically recognise empty strings as missing values. Instead, you have to tell SPSS what defines a missing value. As this is a bit of a pain if the cell is empty, we have already added the string missing to cells with missing data in the .csv file we imported. Note that you still need to tell SPSS that the string missing indicates missing data (i.e., SPSS does not automatically recognise that the string missing in a cell indicates that the data point is missing).
To define the missing value:
Go to Variable View
For each variable with the type
String(i.e.,colour_vision,genderandfirst_language), click onNonein the columnMissingThen click on the icon with the three dots
Click the radio button next to Discrete missing values
Enter
missingin the first text field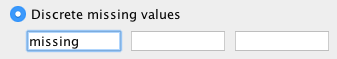
Click
OK
Note that the column Missing should now say missing for these variables: